In the previous blogposts about the error “rom-0“ I was engaged in the procedure of how to “mend“ a vulnerable router, I analysed the spreading of this error and above all I referred to the web test which we in Laboratories CZ.NIC activated at the address http://rom-0.cz. The last blogpost on this topic attended to the development of number of vulnerable boxes in the Czech Republic and in Slovakia during the first four months from the beginning of our measurings.
From that time we realized regular measurings at a usual monthly period, we extended the basic statistical treatment to the whole world and we discovered interesting trends. Above all, however, we published world maps of infestation by the error “rom-0“, maps of changes in time and graphs of development in individual countries on the web – http://report.rom-0.cz/. This web serves above all for the support of our effort to refer to this dangerous mistake the international professional public.
The current map of infestation demonstrates that the unflattering primacy in Europe is still held by Italy.
Despite that there was a great decrease in Italy which marks changes in all the world. Only in November 2014 almost 30 % of the original number of boxes disappeared in Italy, which is in absolute value nearly 35 thousand boxes. The next graph monitors the development in Italy and compares it with the global trend.
A similar progress could have been seen also in other countries, e.g. in Columbia and Thailand. We suppose from various indications that this rapid decrease was caused in mentioned countries by the local majority ISP by the fact that it used a global repair or at least work-around for this vulnerability. The matter concerned could have been either global prohibition of port 80/tcp or massive update of modems. This action is unfortunately thinkable only in relatively homogeneous environment and it is consequently hardly imaginable in our country.
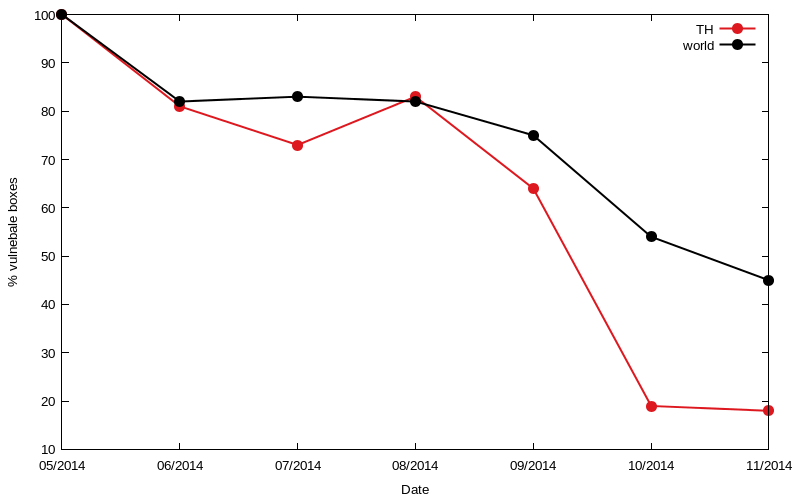
The graph for Thailand demonstrates a significant progress during the persecution of this error. Thailand had during the first measuring in May 2014 in absolute numbers the biggest amount of vulnerable boxes in all the world. At present, however, over 80 % of the original number of them disappeared. This means a decrease by 136 thousand vulnerable routers during six months. Again the biggest jump occurred in one month when 76 thousand vulnerable boxes disappeared at the same time.
In total there was a significant decrease in most countries which had big share during the first measuring. The next graph compares the first and the last measuring in 15 most contaminated countries (according to the first measuring).
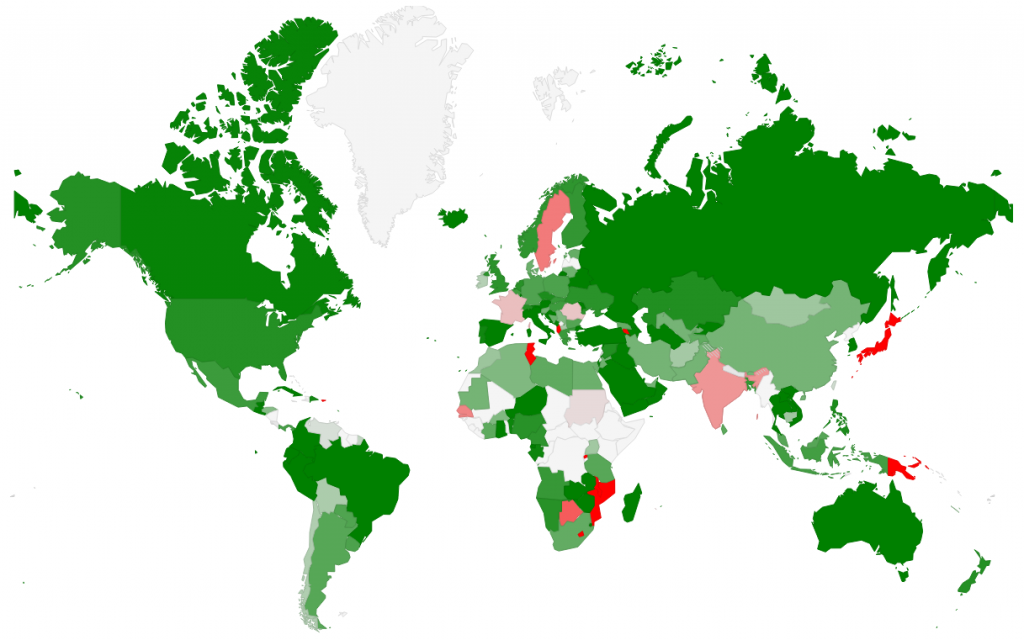
A globally positive trend is demonstrated by the map which shows the difference between the first and the last measuring. Green represents decrease, red represents increase. By clicking on the picture you get to the interactive version.
From the original worldwide number of 1.219,985 vulnerable routers from May 2014, almost 55 % already disappeared. This is undoubtedly a very positive message. It does not mean, however, that there are still at least 550,080 vulnerable boxes missing.


